How to use?
Use the Add-on
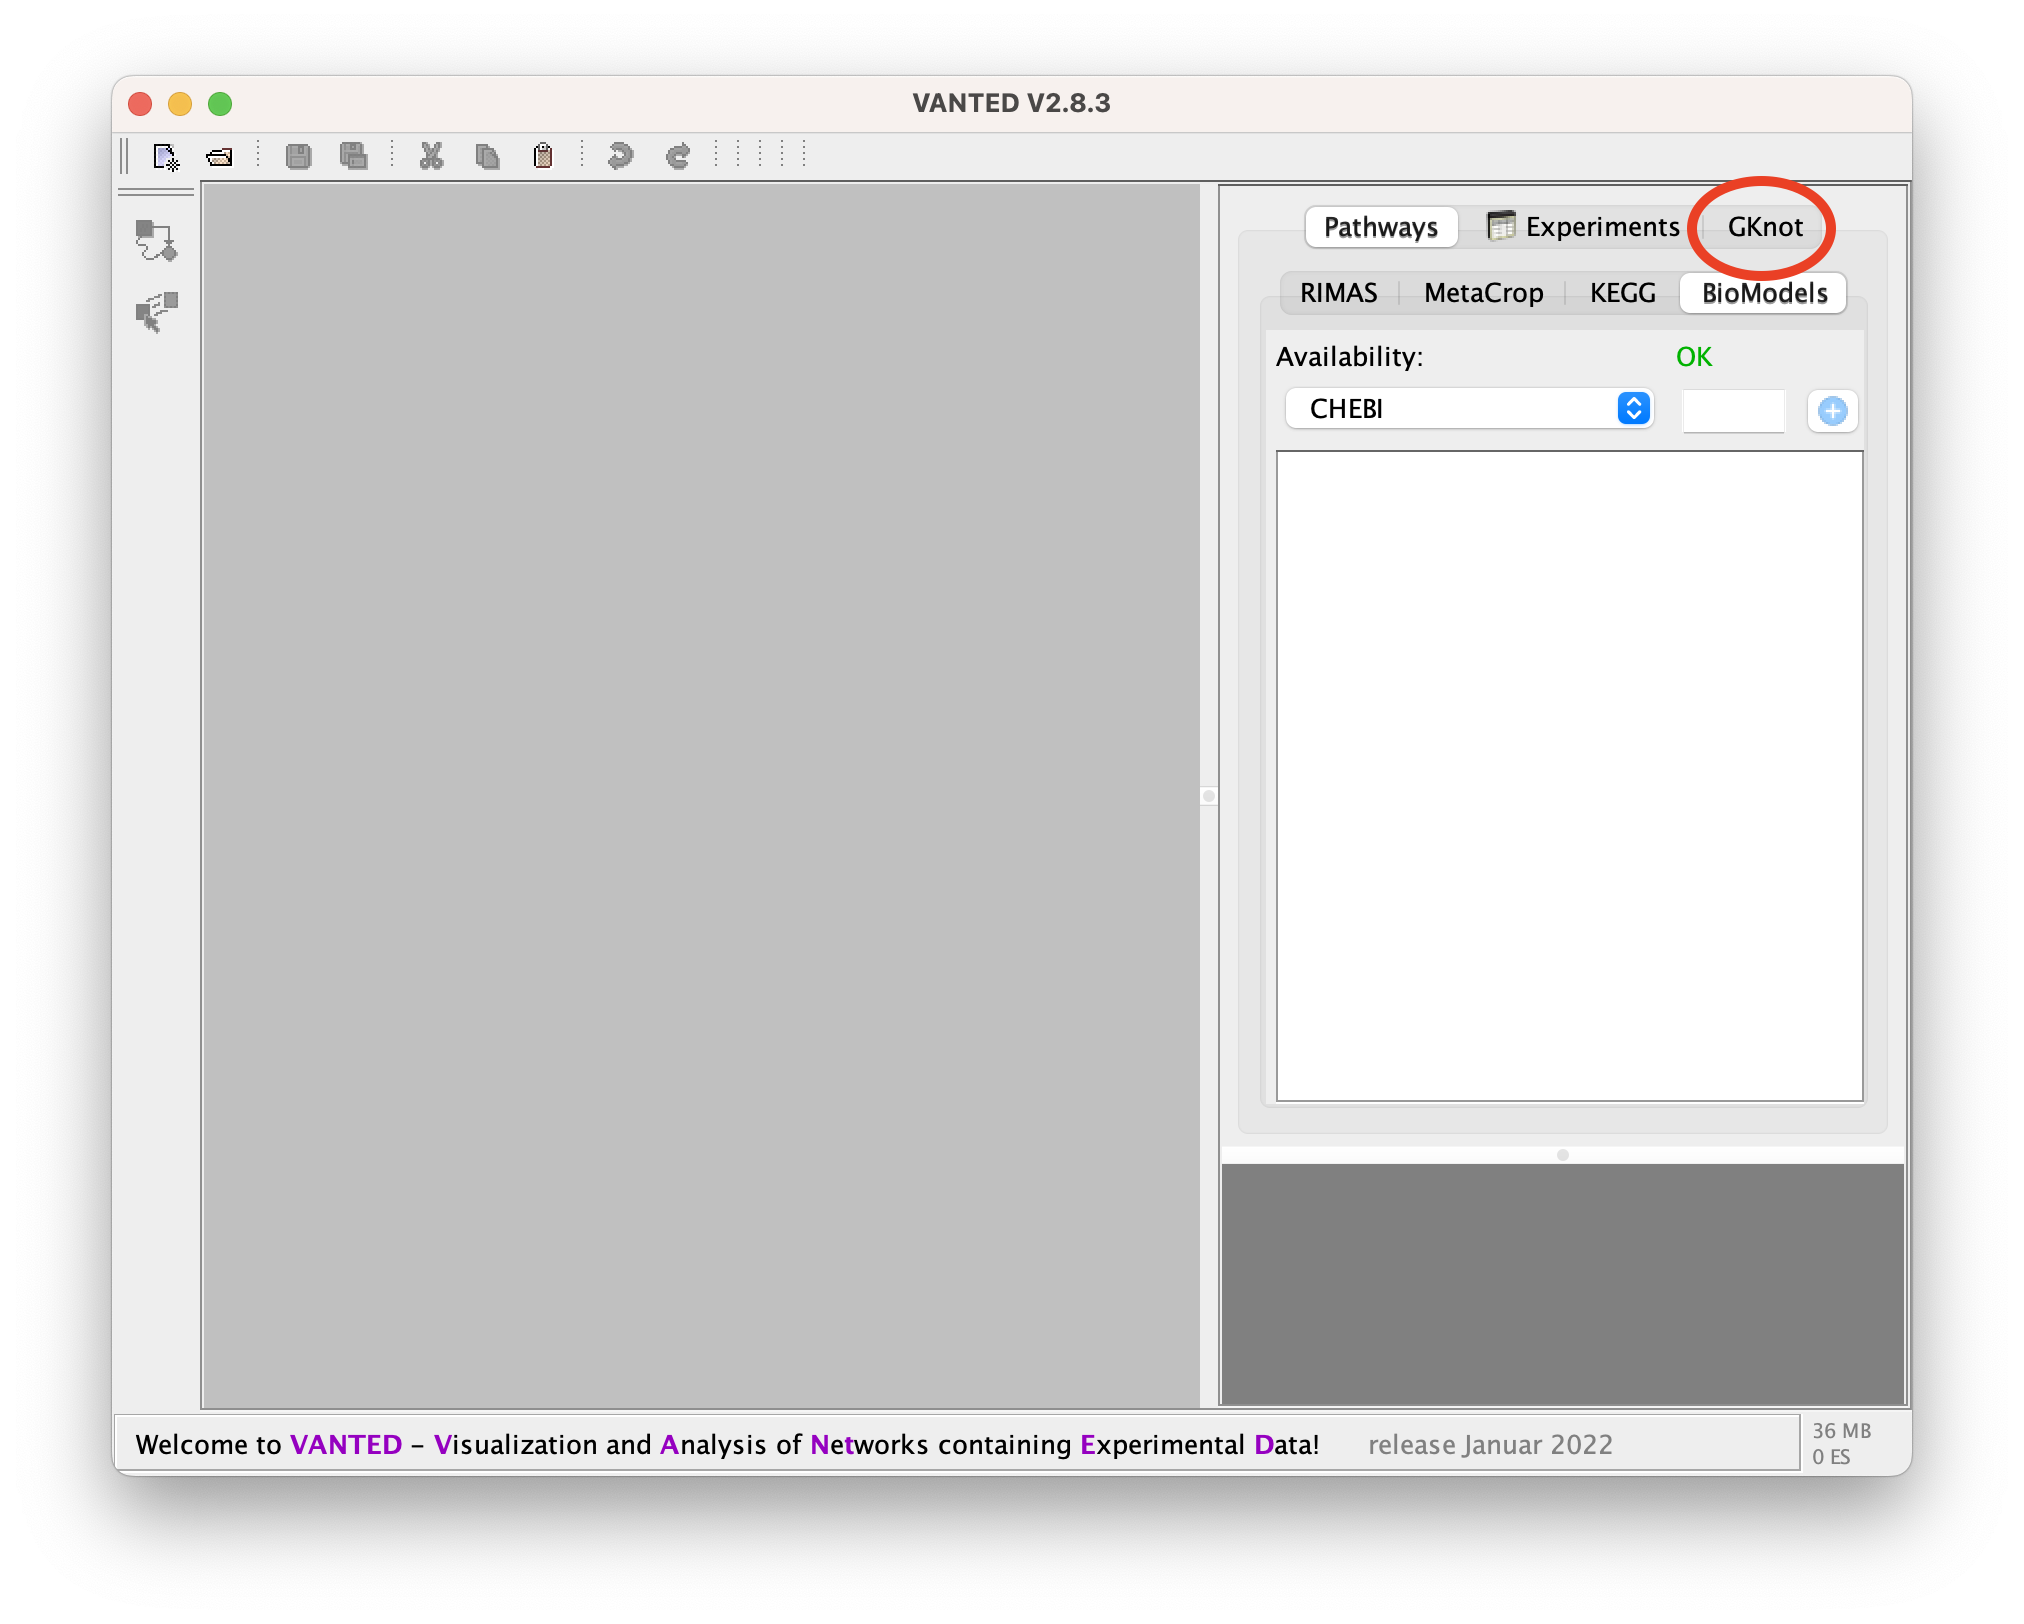
To get to the GUI of the add-on please click on the 'GKnot' tab.
Create a graph
You can create a new Graph either from scratch, extend some of the example Graphs, that come pre-loaded with the extension, or load a file of a Graph. You are allowed to create any Graph that is planar and has nodes of degree two and four.
Create an empty new Graph
To create an empty graph you have to press on the button 'Create Empty'.
Open sample Graph
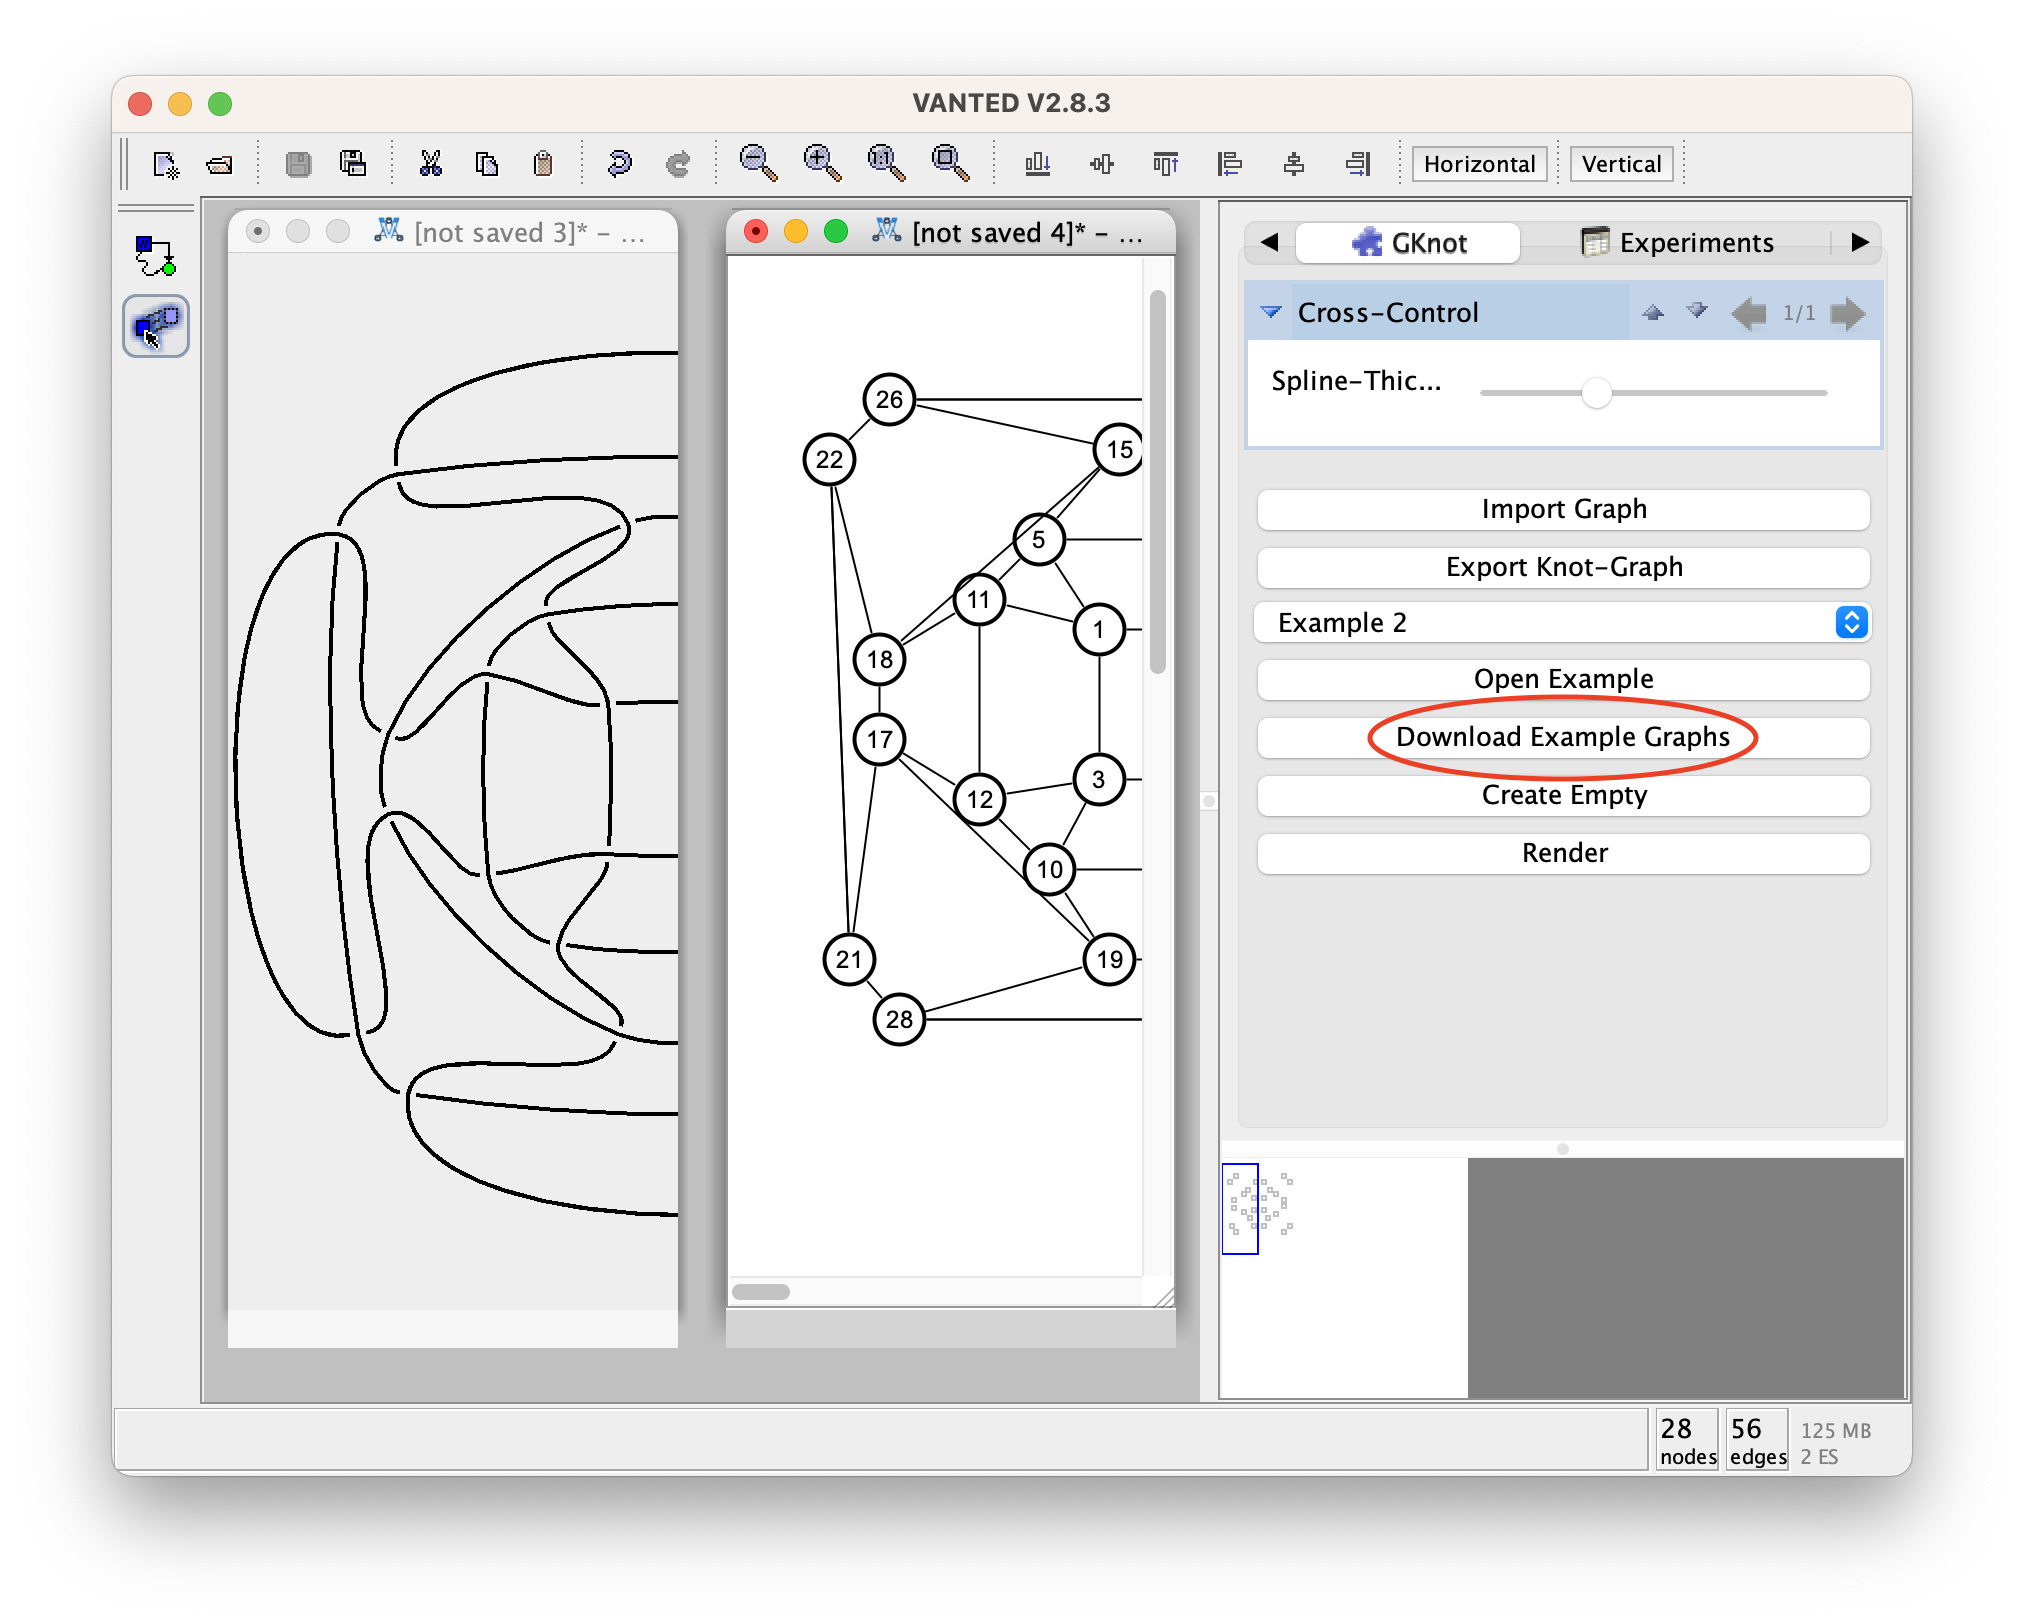
Before you can use the example graphs you have to download them by clicking 'Download Example Graphs'. This only has to be done once.
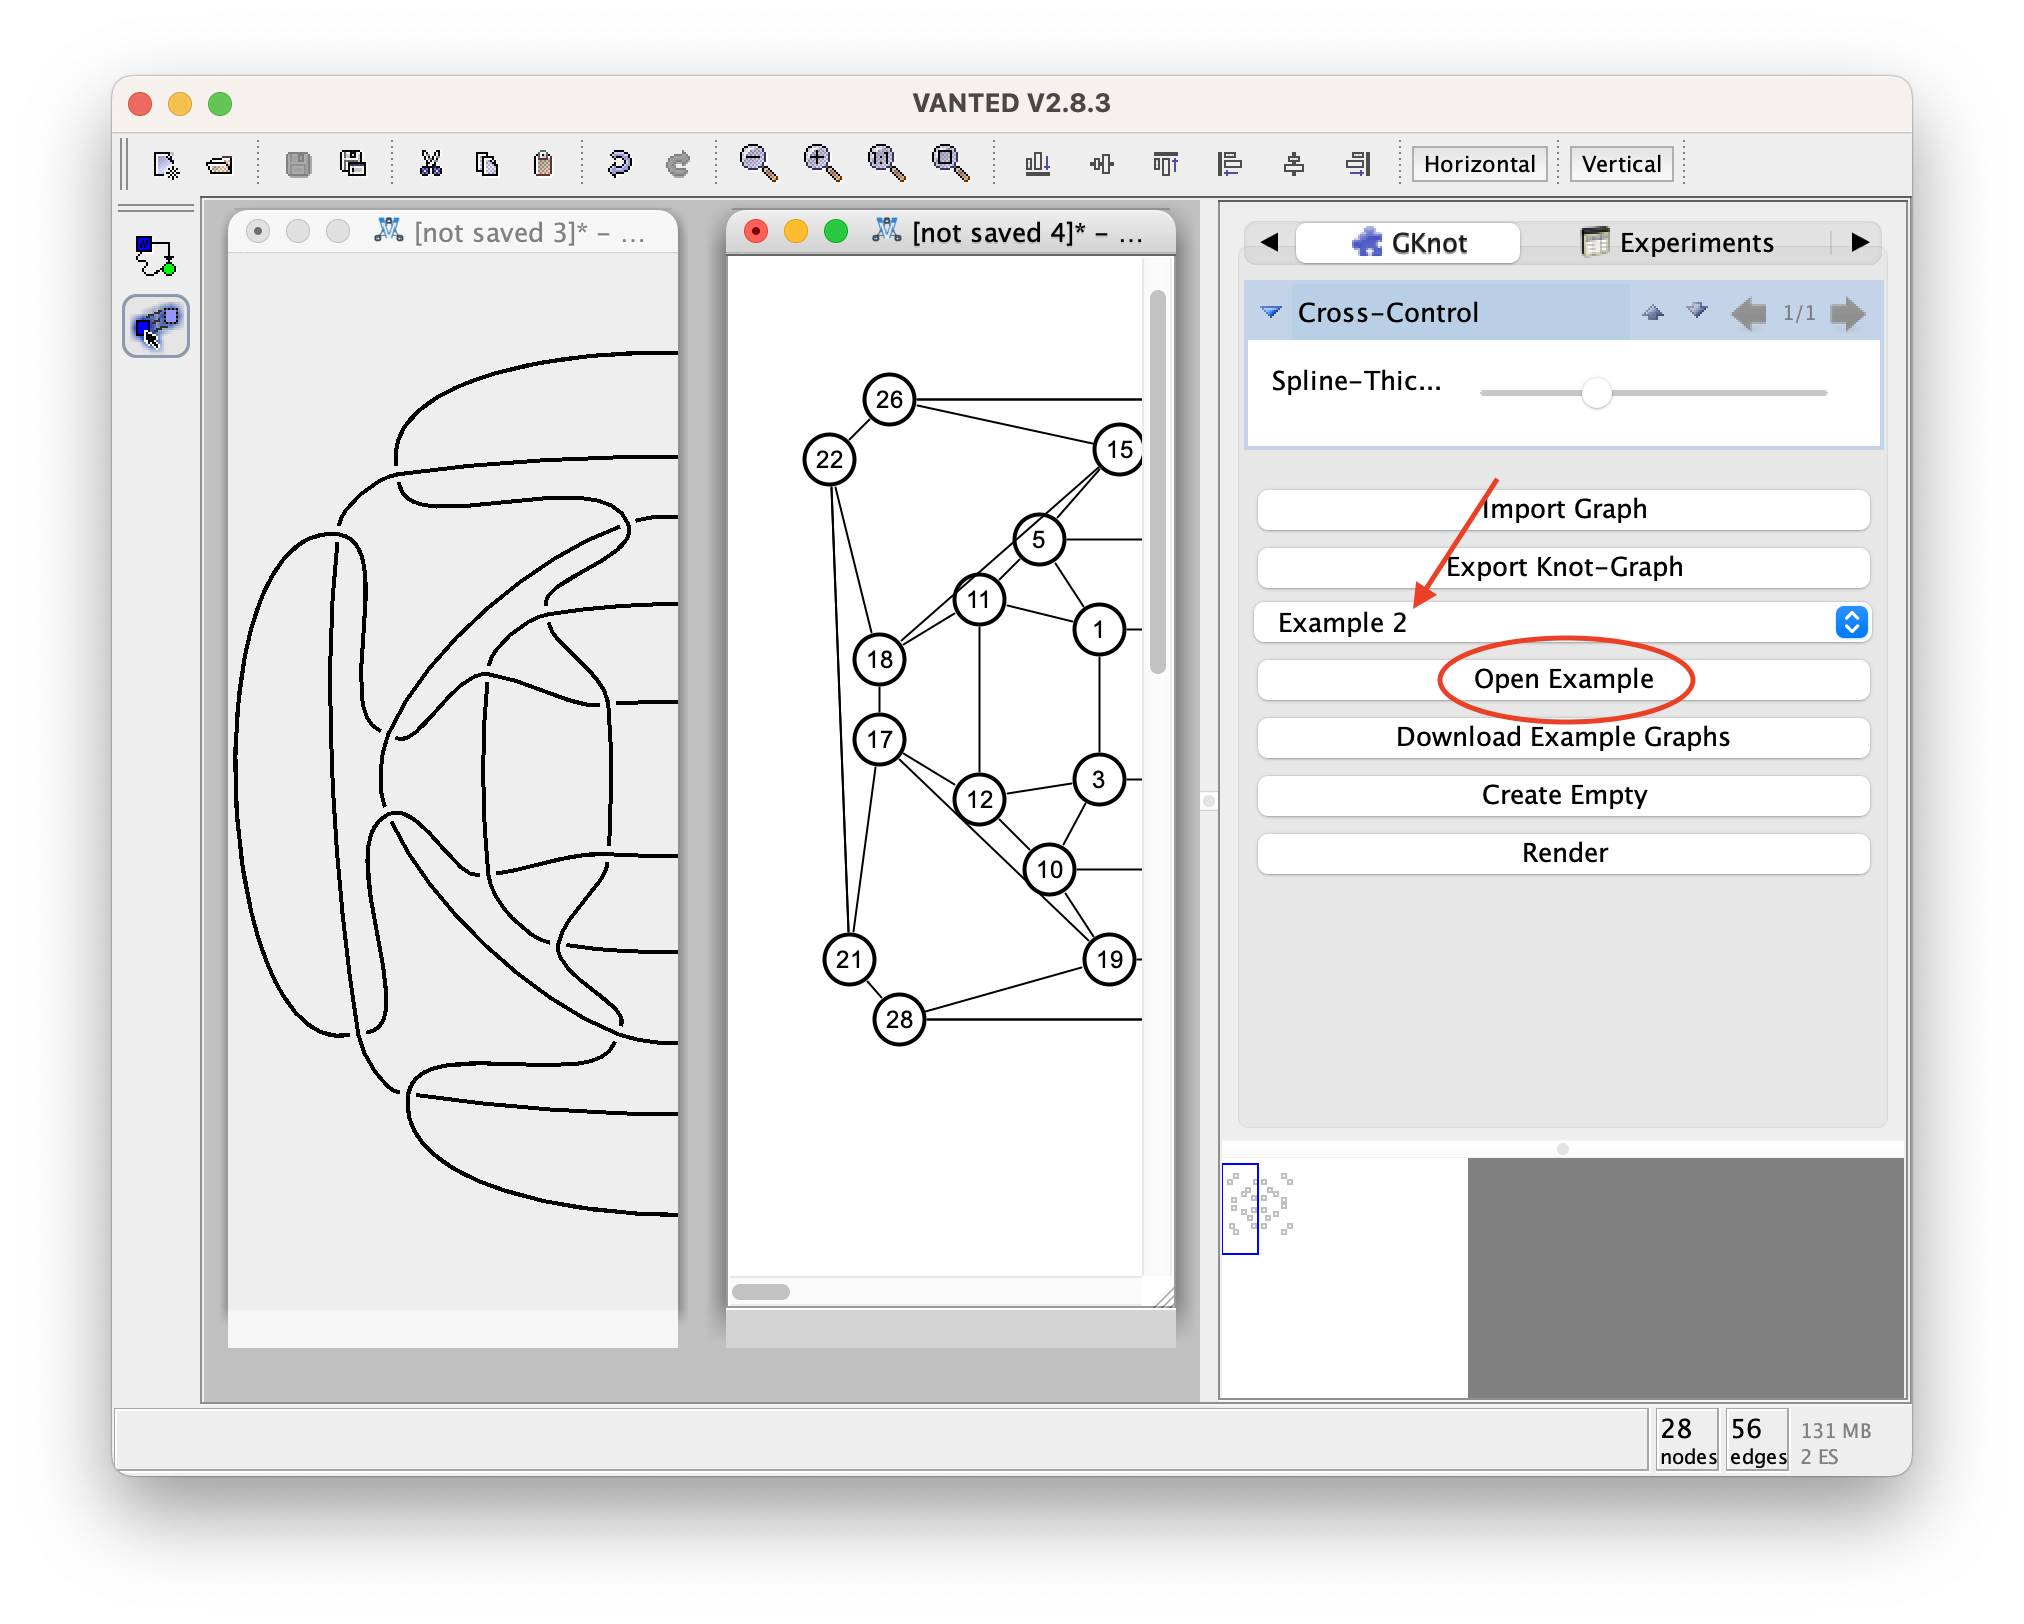
Then select the graph you want to import from the drop-down menu and press: 'Open Example'.
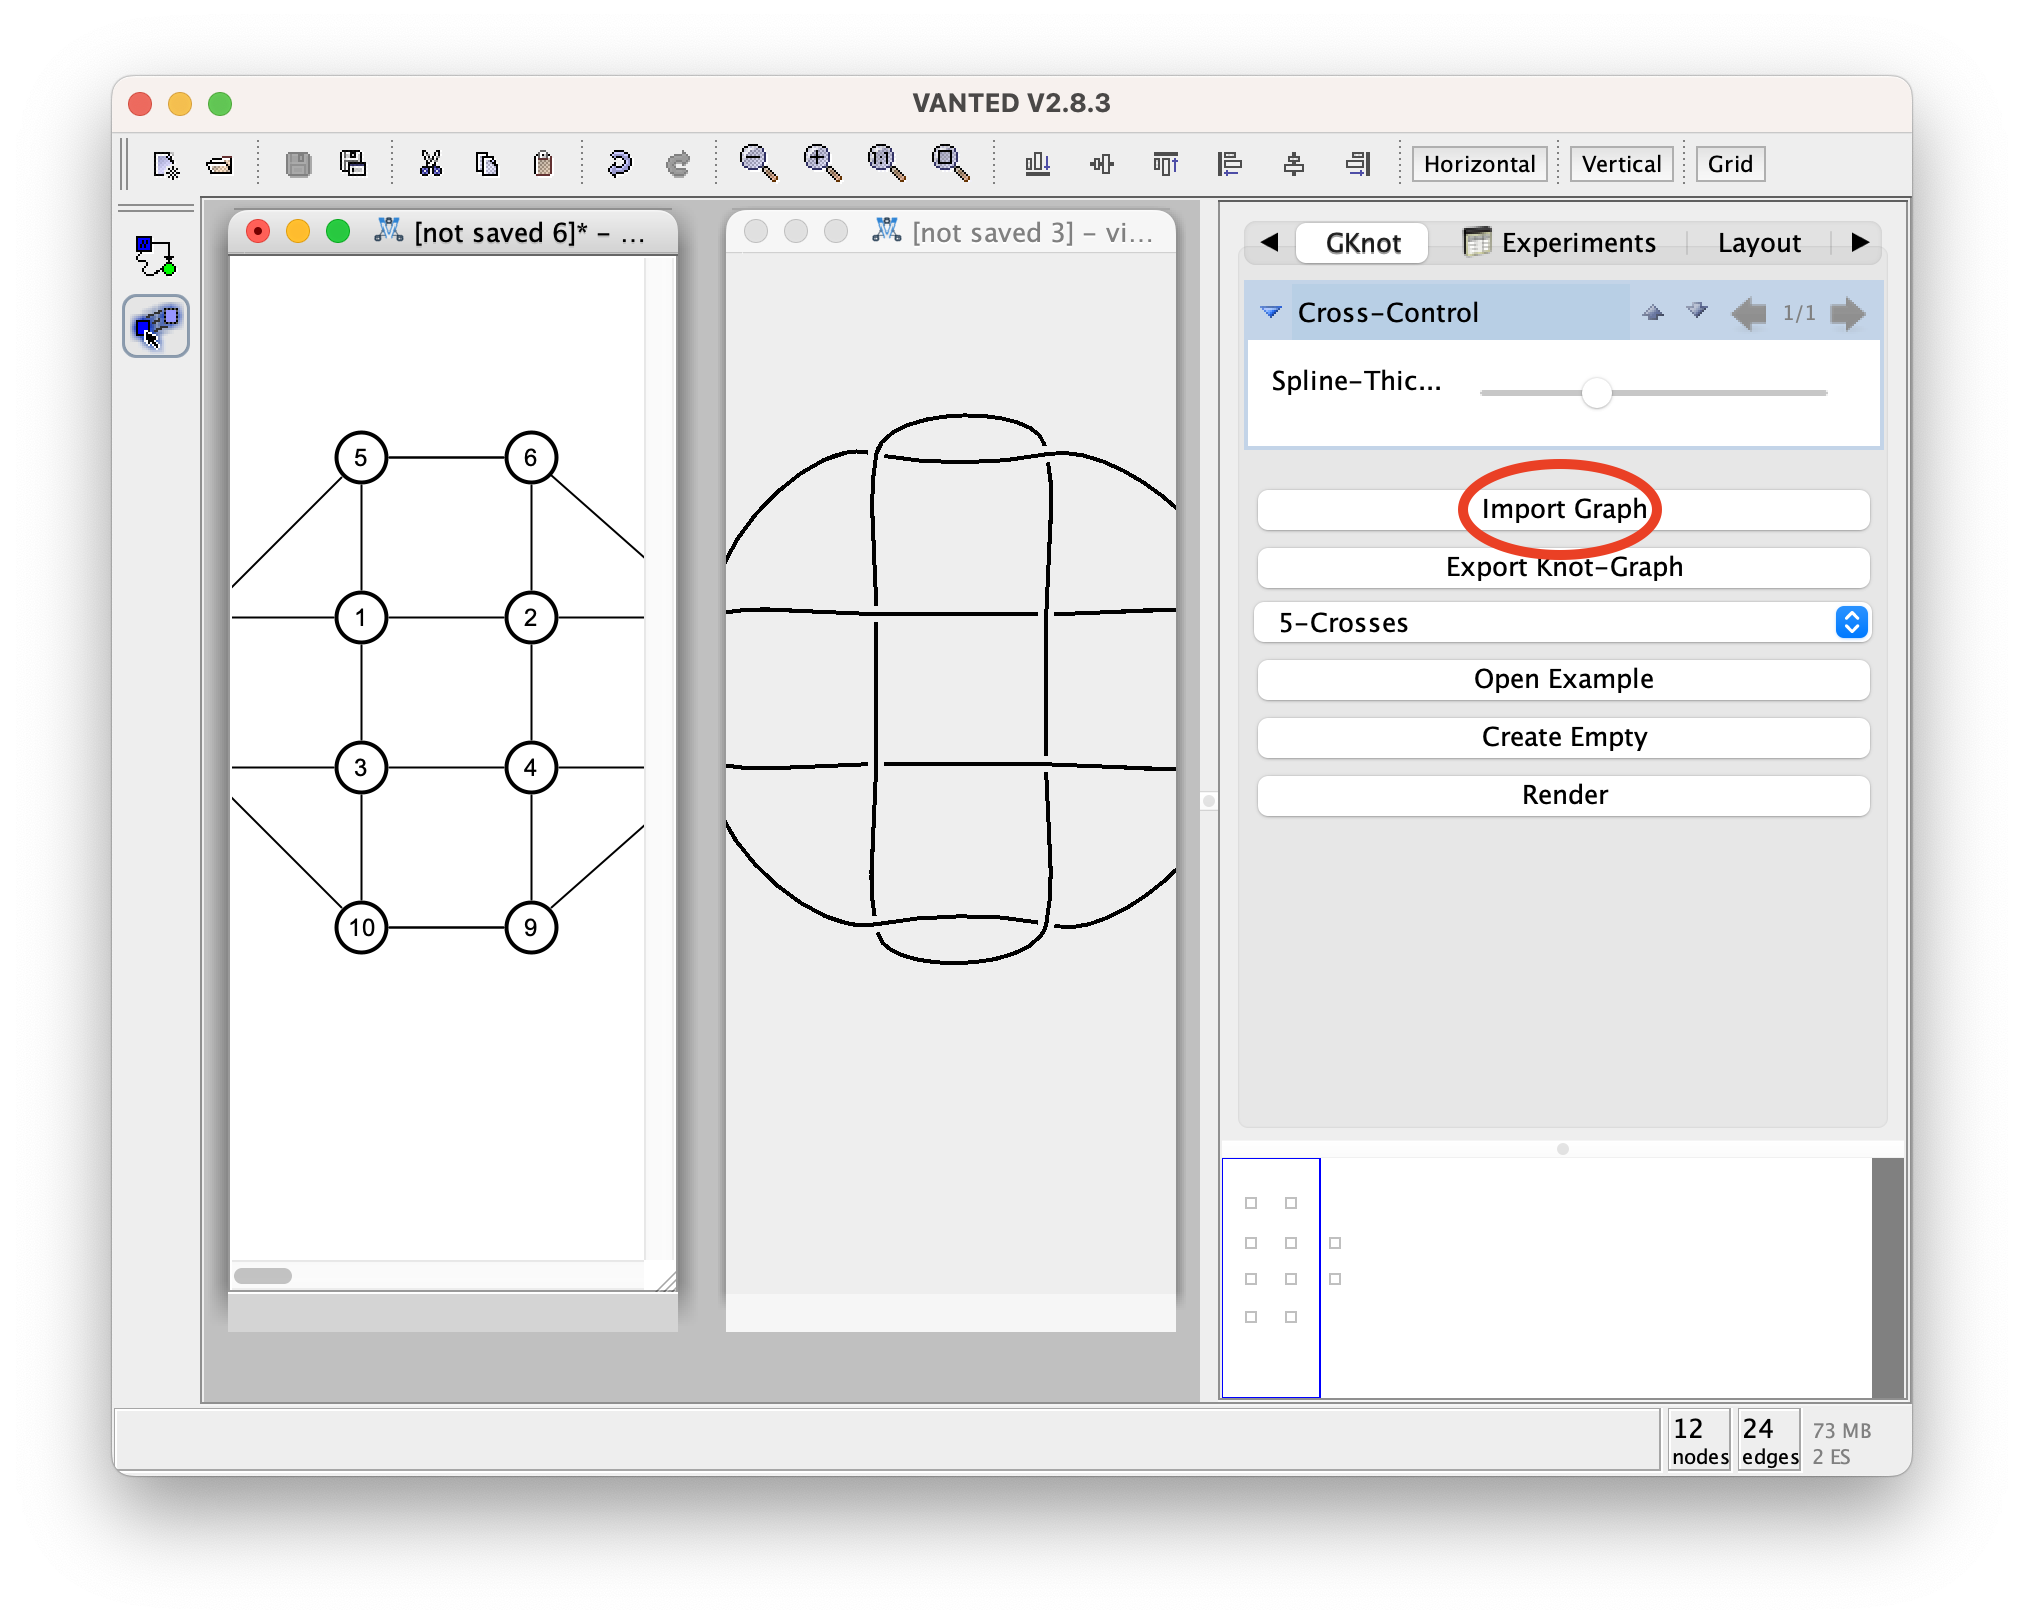
Import Knot-Graph
Graphs can be imported from a .gml file.
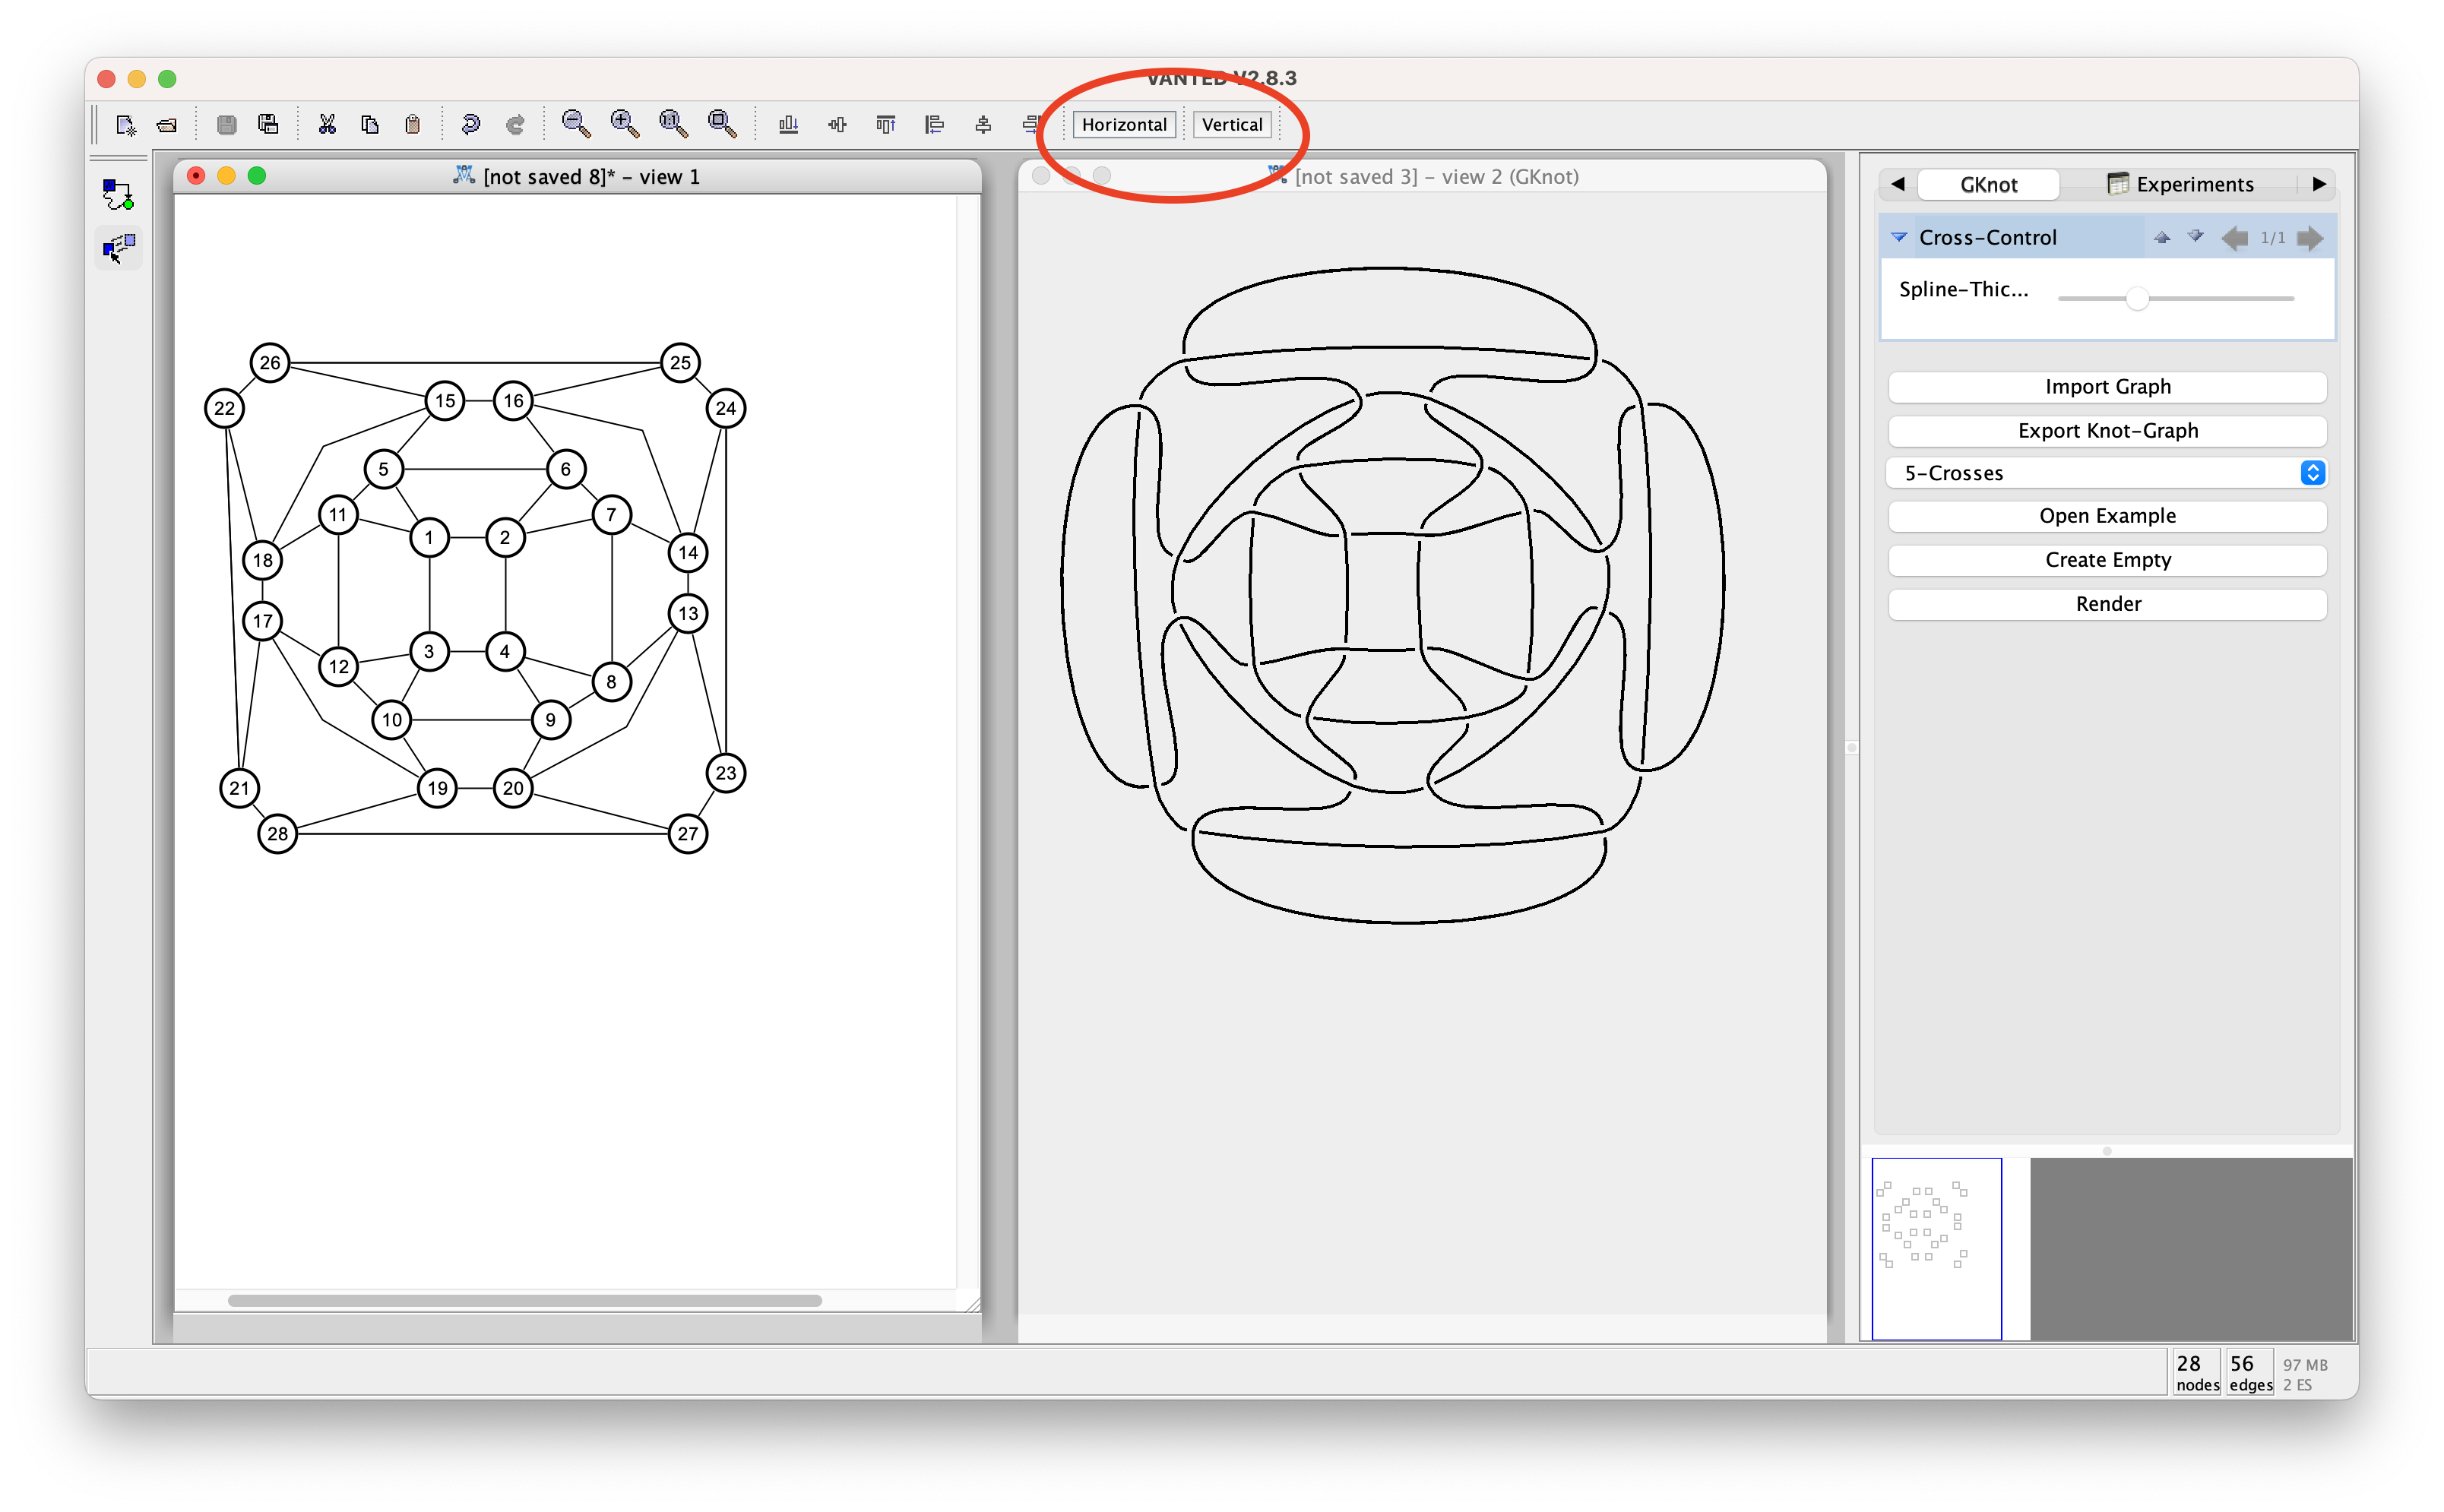
Align the windows.
If you want to align the windows automatically to fit the workspace you can click on the buttons 'Horizontal' align the windows horizontally to or 'Vertical' for vertical alignment of the windows.
Interaction with the graph
To change the style of the graph (knot graph) you may either interact with the nodes, or directly with the derived visualization via the crosses.
Create Rendering
If the structure of the whole graph is changed, you can re-render the visualization, by clicking the buttom 'Render'. However this will produce an error, if the graphs topology does not match the requirements.
Export Graph
You are able to export your graphs in a format, which can be interpreted by the 3D-Modelling
software Blender via a script, which you can download further below.
For this simply press the 'Export Graph' buttom. You may also save the graph in a .gml format to reuse the graph later.
The Format is produced in the following schema:
Let C1 be the first Cross which is connected to C2 and ControlPoint2 be the opposite arm.
(C1.ControlPoint1.x, C1.ControlPoint1.y) (C1.y, C1.y) (C1.ControlPoint2.x, C1.ControlPoint2.y)
(C2.ControlPoint1.x, C2.ControlPoint1.y) (C2.x, C2.y) (C2.ControlPoint2.x, C2.ControlPoint2.y)
...
This cycles through every threaded circuit of the knot graph. When a new threaded circuit is started a '*' is written into an otherwise empty line.
Script for the use in Blender
Step 1 - Download and Install Blender
Step 2 - Download and use the script
First dowload the latest version of the script.
After that, put the cli-script.blend file in the same folder as the .kvg knot graph.
Open your terminal, navigate to your .kgv file and use the following command: